> ## Documentation Index
> Fetch the complete documentation index at: https://dify-6c0370d8-release-1-15-0.mintlify.site/llms.txt
> Use this file to discover all available pages before exploring further.
# ダッシュボード
> Dify の組み込み分析ダッシュボードを通じて、パフォーマンス、コスト、ユーザーエンゲージメントを監視
> このドキュメントは AI によって自動翻訳されています。不正確な部分がある場合は、[英語版](/en/cloud/use-dify/monitor/analysis) を参照してください。
ダッシュボードは、アプリケーションのパフォーマンスを示すために、時間の経過に伴う 4 つの指標を追跡します:
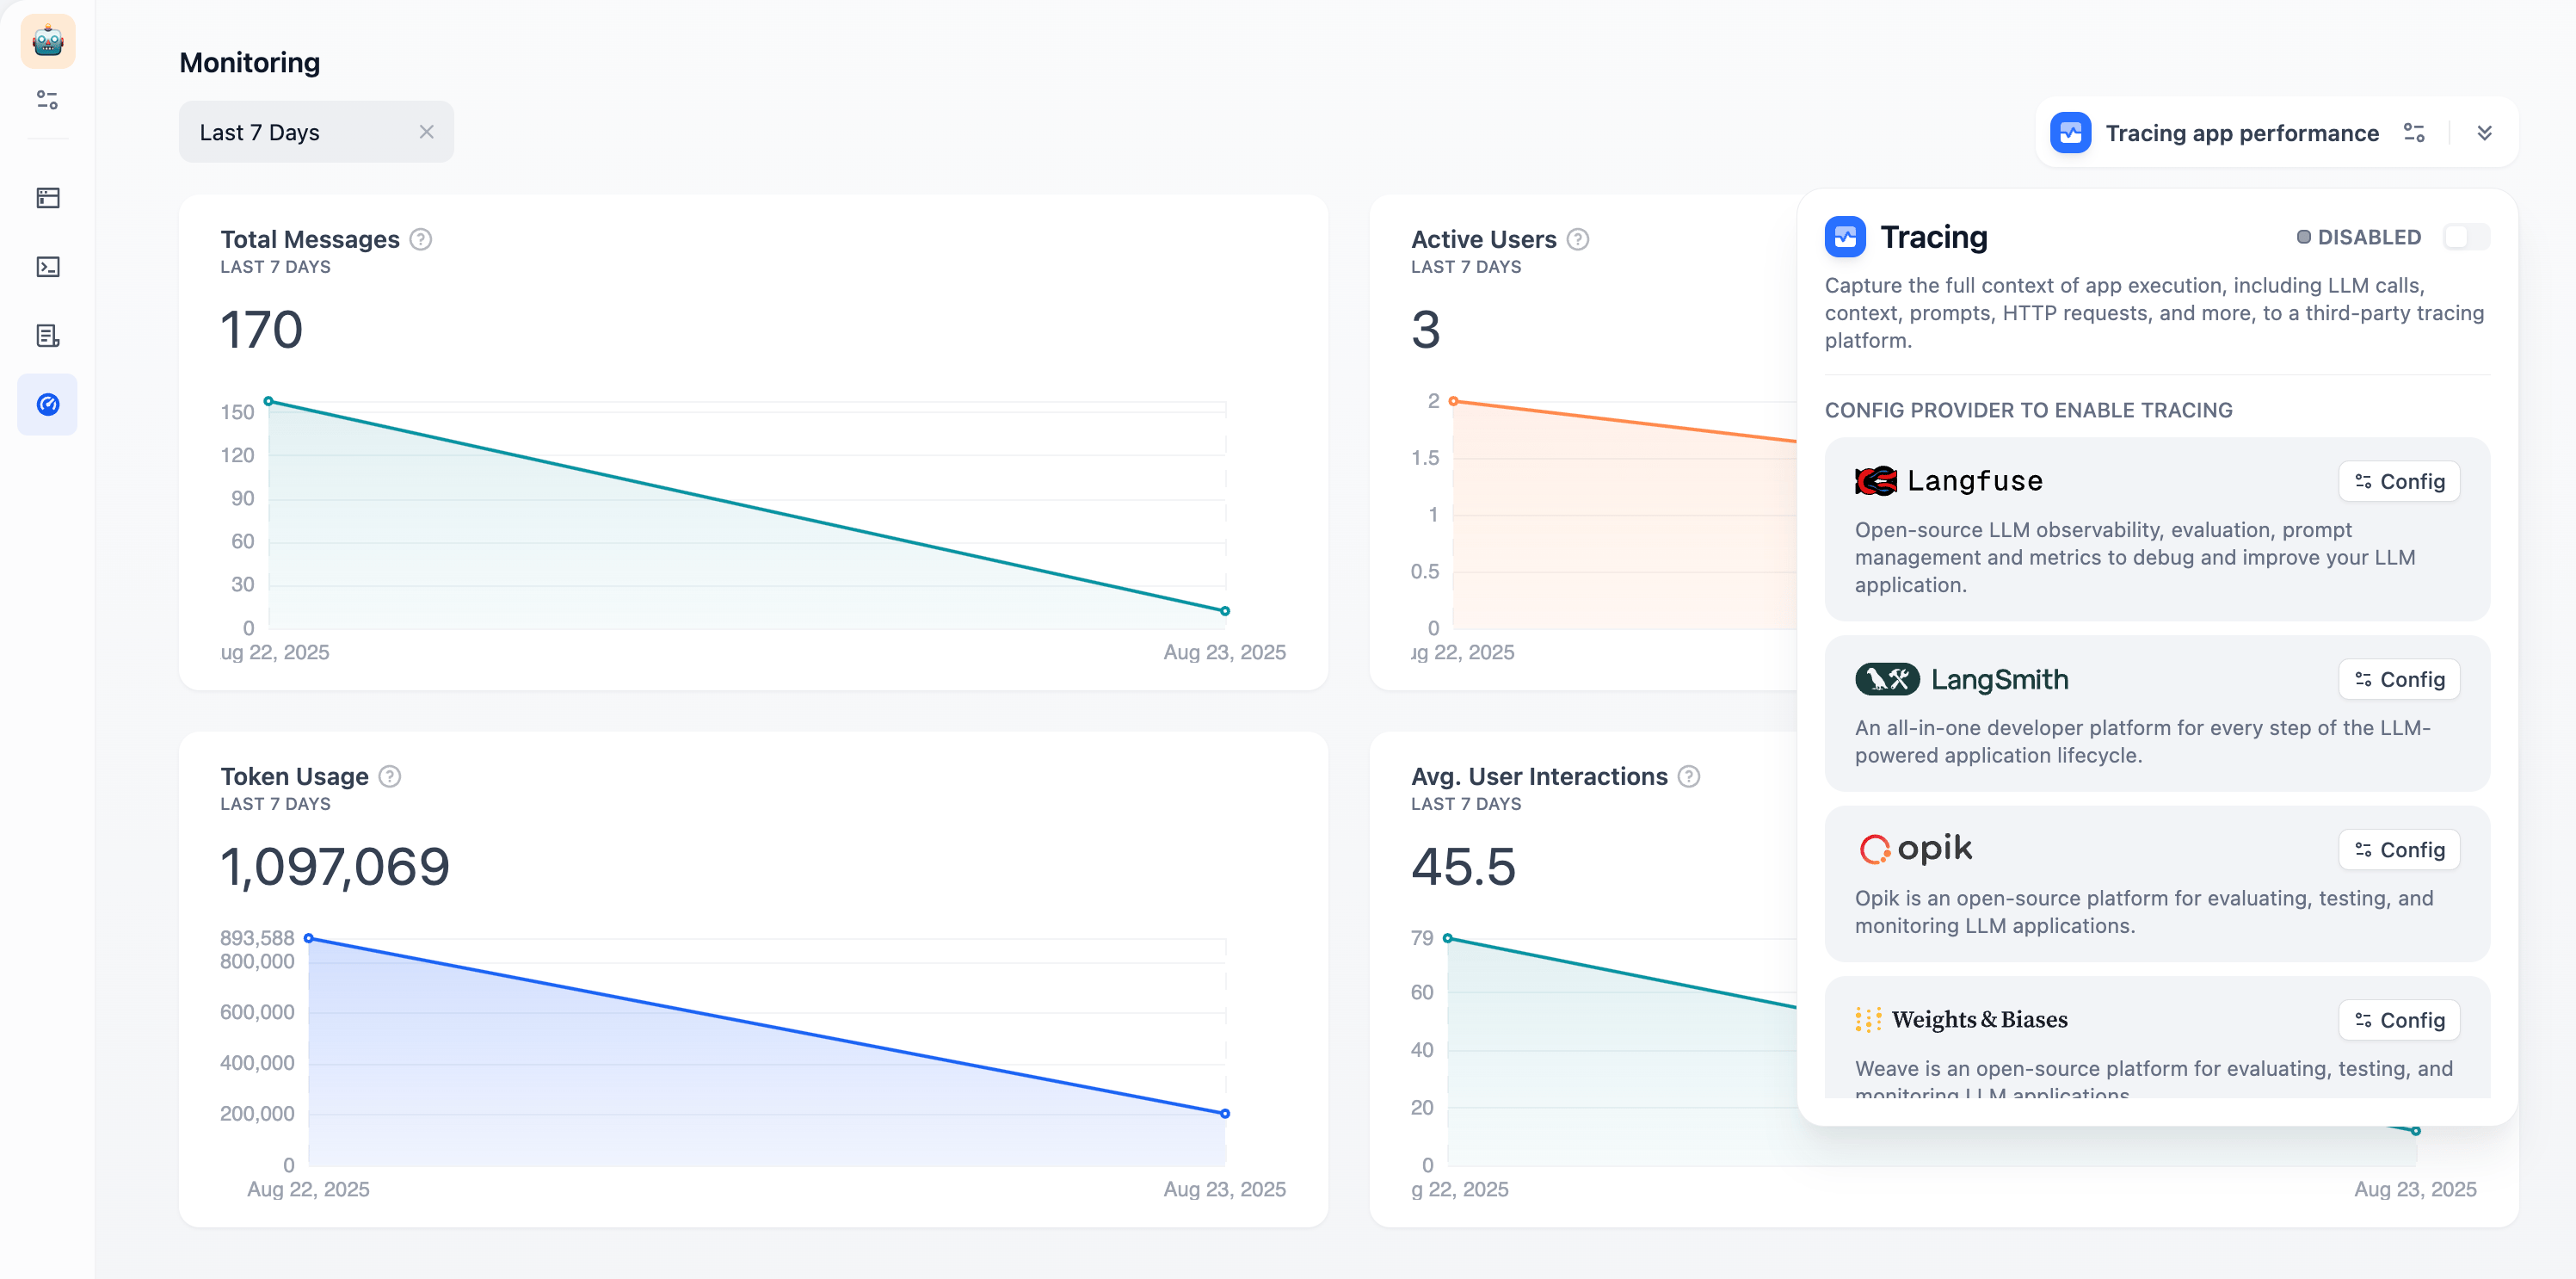 **Total Messages**:会話のボリューム\
**Active Users**:意味のあるインタラクションを持つユーザー(複数のやり取りがある)\
**Average User Interactions**:セッションごとのエンゲージメントの深さ\
**Token Usage**:リソース消費とコスト
時間セレクターを使用して、異なる期間のトレンドを確認します。**「アプリのパフォーマンスのトレース」** をクリックして、Langfuse や LangSmith などの外部可観測性プラットフォームに接続し、より深い分析を行います。
**Total Messages**:会話のボリューム\
**Active Users**:意味のあるインタラクションを持つユーザー(複数のやり取りがある)\
**Average User Interactions**:セッションごとのエンゲージメントの深さ\
**Token Usage**:リソース消費とコスト
時間セレクターを使用して、異なる期間のトレンドを確認します。**「アプリのパフォーマンスのトレース」** をクリックして、Langfuse や LangSmith などの外部可観測性プラットフォームに接続し、より深い分析を行います。